We have a different take on the canned ‘Share of Voice’ metric
Most clients understand intuitively that old-fashioned Advertising Value Equivalent (AVE) metrics are to be strictly ignored as they offer no meaningful information or strategic value. Glib reporting can actually do damage by distracting decision-makers from what matters to the business.
We’ve generally found other canned metrics—the ones easily pulled from media monitoring tools—to be unhelpful. Take Share of Voice as an example:
- Like AVE, it’s borrowed from the advertising world. Share of Voice originally referred to a brand’s share of an advertising space relative to competitors.
- In our experience, it offers value only if the quality of coverage is taken into account. No one should care about mentions in news-release pickups by obscure sites visited only by bots.
That said, the concept of Share of Voice isn’t bereft of value the way AVE is. So, we find ways to “un-can” it to make it useful. In order to do that, we have to focus on media-coverage highlights.
Identifying media coverage highlights
A first step we take in our reporting is to separate out the more meaningful media coverage—what we call highlights—from all the other less impactful media mentions or minor inclusions in stories. We may provide some additional context (“outcome for NY media tour” or “widely syndicated article”) in notes we include to accompany this reporting.
As for what makes a highlight, that depends on the PR/communications program’s objectives. We set those goals at the outset and then measure progress against them. One of the most basic goals is increasing what we often refer to as “marquee coverage.” What’s marquee coverage for one client might not be for another. Depending on the target audience, marquee coverage can vary from the New York Times to a regional newsletter for accounting professionals.
By centering our reporting on highlights, both we and our clients stay focused on the outcomes aligned with goals.
Making Share of Voice meaningful
Having first put the focus where it should be, we can now add nuance through another layer of analysis.
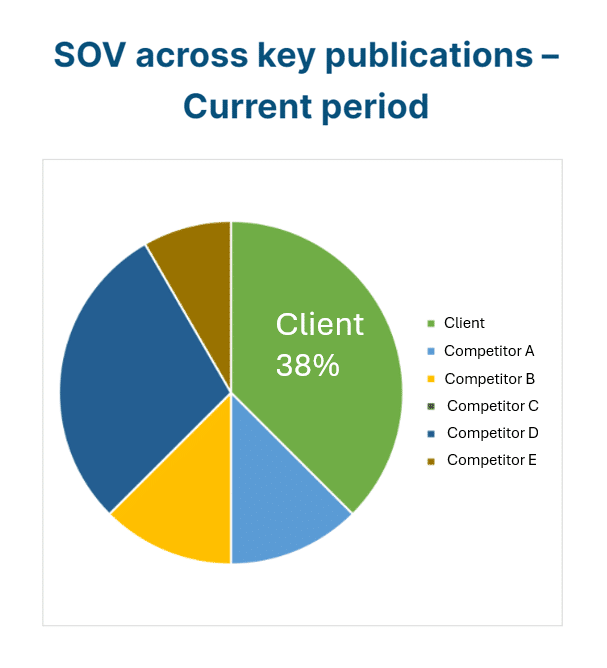
At the outset of a PR program, we can define a specific set of publications to consider. Then, we can track and compare both client and competitor mentions in those publications over time. An objective could be raising the ratio of client to competitor mentions within the targeted subset of publications. This approach eliminates the noise.
Custom charts
Making Share of Voice useful boils down to two points:
- Set the objective in advance; and
- Limit analysis to data that relates to the objective
Those same concepts can guide use of other metrics, too—whether “un-canning” concepts from automated reporting systems or custom-developing metrics to illuminate progress toward established objectives.
One type of custom chart we often use is frequency of media mentions over time for each of several spokespeople. Often clients have an objective to raise the profile of supporting team members rather than relying heavily on one senior leader. A time series showing mentions over time—but only from Highlights, not from anywhere on the internet!—is a powerful way to demonstrate progress toward that end.
Subscribe.
Receive the latest news and insights from Lowe Group.
